
Accelerating Cyber Investigations with Velocity XDR’s Integrated Behavioral Analytics
Sygnia’s Velocity XDR uses UEBA not only to form a baseline for detecting anomalies, but also make the internal data easily accessible to platform users.
Cyber data analytics is a crucial aspect of modern cybersecurity, and one that is notoriously difficult to perform. Whether done by in-house SOC teams when investigating security alerts issued by an XDR platform, or by external cyber investigators who collect ad-hoc organization data to reveal a threat actor, both methods require manually sifting through millions of rows of unaligned, raw logs.
Sygnia expanded its proactive security offering to include managed extended detection and response (MXDR). It’s powered by Sygnia’s proprietary technology, Velocity XDR which has a rich pedigree of success empowering Sygnia IR teams to defend clients across thousands of IR engagements.
Ready to amplify your security operations? Book a Demo to see Sygnia’s Velocity MXDR in action.
Although Velocity XDR has numerous unique features – such as automatic, scalable forensic data collection and real-time threat intelligence – this article focuses on one of its analytical capabilities: the fusion of top-down security knowledge with statistical behavioral data. While it is true that several XDR and SOC platforms have integrated User-Entity Behavioral Analytics (UEBA) in their products, in Velocity XDR, we take a different, ‘analysis-first’ approach: we use behavioral data not only to form a baseline for detecting anomalies, but also make the internal data easily accessible to platform users. This enables Velocity XDR users to quickly obtain answers to sophisticated analytical questions.
Here’s how it works.
Cyber triage from top to bottom
Traditionally, analysts and security products have used a ‘top-down’ approach, relying on experience in the field and familiarity with past attacks and threats, and searching for evidence of those known threats in the data. This approach, however, is not always suitable for detecting concealed or highly sophisticated malicious behavior that has not been identified a priori.
UEBA from bottom to top
While security analysts search for known threats in vast amounts of data, UEBA systems take a different direction, performing a bottom-up process, by first ‘understanding’ the data, which often contains millions of daily events and interactions, and then identifying suspicious or abnormal behavior.
This ‘bottom-up’ analysis is done by tracking behavioral patterns of users and entities, and triggering alerts for statistically anomalous activities. UEBA-based insights are often collated into a ‘top risky users’ table, which contains details of user accounts that were associated with numerous ‘anomalies’ in a short period of time. Although this approach seems promising for detecting unfamiliar and suspicious activity, it also generates many false-positives, due to the dynamic nature of modern network environments.
UEBA as queryable data in Velocity XDR
The goal of most UEBA products is to generate anomaly-based alerts. In light of Velocity’s different, ‘analysis-first’ approach we prioritize publishing the underlying data of the UEBA framework as structured data, which can then be queried by cyber analysts in the course of investigation or triage processes.
In this article we focus on three main layers:
- Entity Data Layer, which tracks the same user or machine across different sources.
- Behavioral Patterns Layer, which tracks the ‘standard behavior’ of entities.
- Anomalous Activity Layer, which stores all abnormal events.
Since these newly added data layers are, in fact, a summarized extraction of raw data, they are significantly lighter in storage and can therefore be retained for much longer than the original logs.
Next, we explain how these data layers support and enhance triage, threat-hunting, and investigation processes.
1. Entity data layer
Security and application logs are often not aligned with each other, making it difficult to unify disparate pieces of information. This brings us to one of the main challenges in cyber analytics: tracking the activities of different entities (users and hosts, for example) across multiple different sources. For example, Organization\Jane.Doe could be a username that appears in Windows Event logs, with JDoe@organization.com being the same user’s Office 365 account, and Doe.J the VPN user, with all the names referring to the same person: Jane Doe.
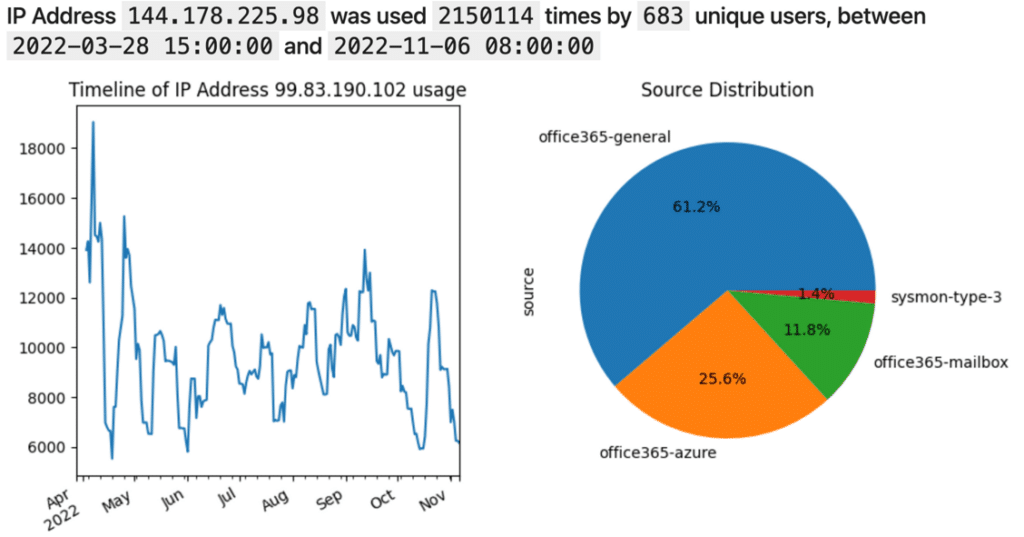
The Velocity XDR platform enables its users to easily query an organization’s global entity table, in order to obtain the first and last appearance of an entity across all sources, as well as additional properties or attributes (such as IP addresses, and user agent/browser types) that were associated with the entity over a certain period of time.
Examples of investigative queries using Entity Data:
1. How frequently is the IP address 99.83.190.102 used in the organization?
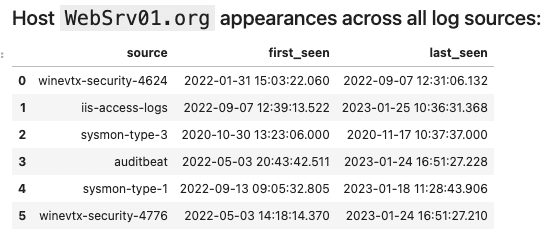
2. When was the WebSrv01 host first seen, and on what log sources?
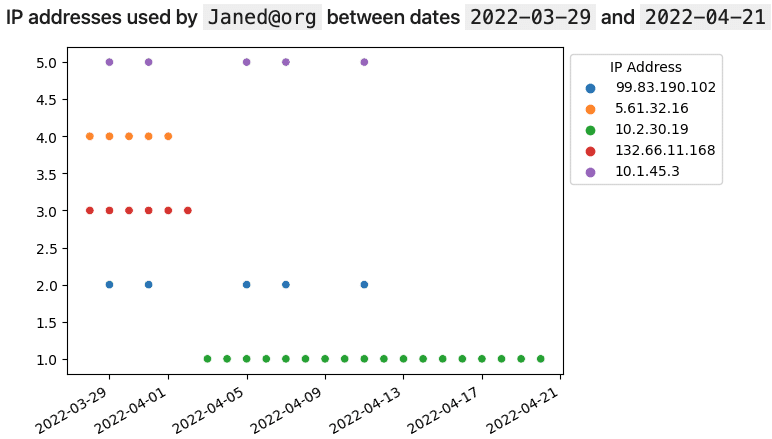
3. What IP addresses were used by user Janed?
2. Behavioral patterns layer
UEBA systems record entities’ behavior in order to form a ‘baseline’, which is used to determine what constitutes anomalous behavior. Records of entities’ behavioral patterns can be extremely valuable in investigative processes. To allow users to query UEBA internal data, entity behavior is first divided into numerous individual pattern types. For user entities, these patterns could be logon times, directories accessed in Office 365, or geolocation access via Microsoft Sign-in; for host entities, such patterns can include process executions, and outgoing network traffic volumes. In Velocity XDR, users can examine those patterns, and also track changes in behavior as time goes by. Additionally, each pattern has important metadata that can be used for investigations, such as the pattern’s recording time, and the number of raw events that it covers.
Examples of investigative queries using the Behavioral Patterns Layer:
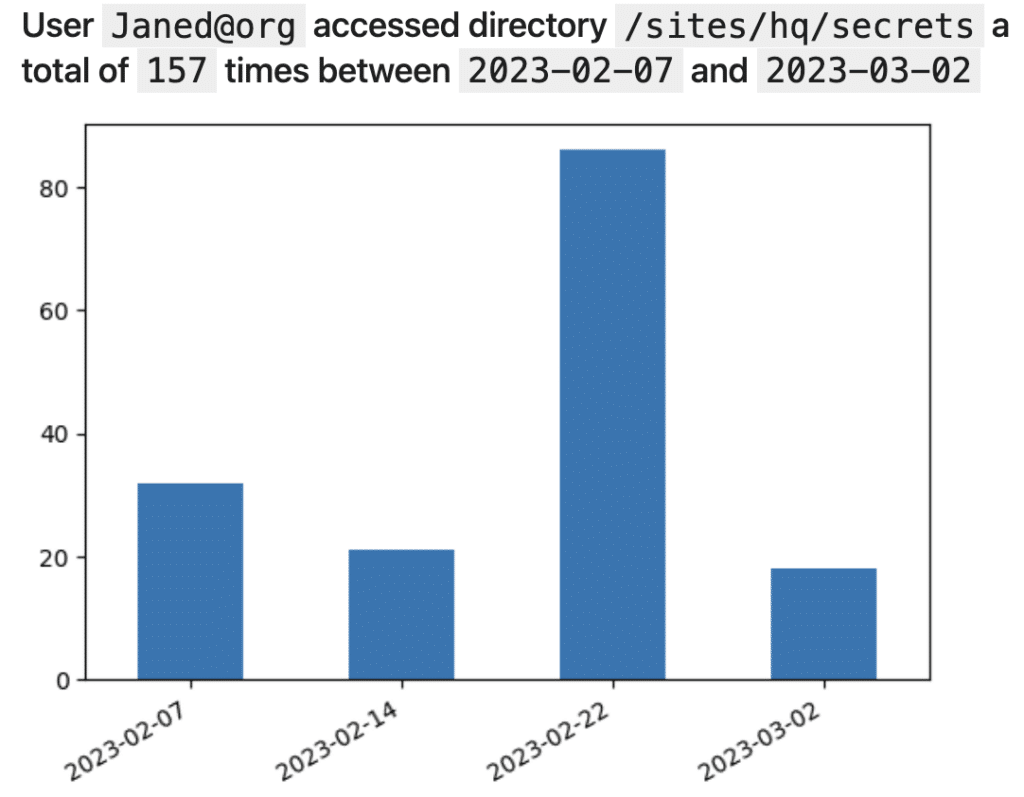
1. How many times did Jane Doe access the ‘/sites/hq/secrets’ shared folder in the past month?
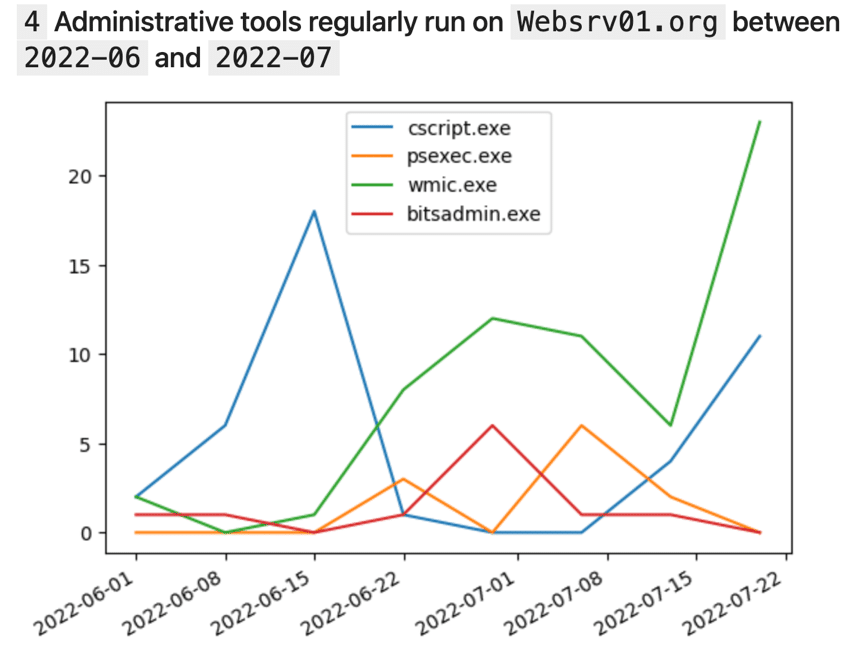
2. What admin tools are regularly executed on the WebSrv01 host, during June and July 2022?
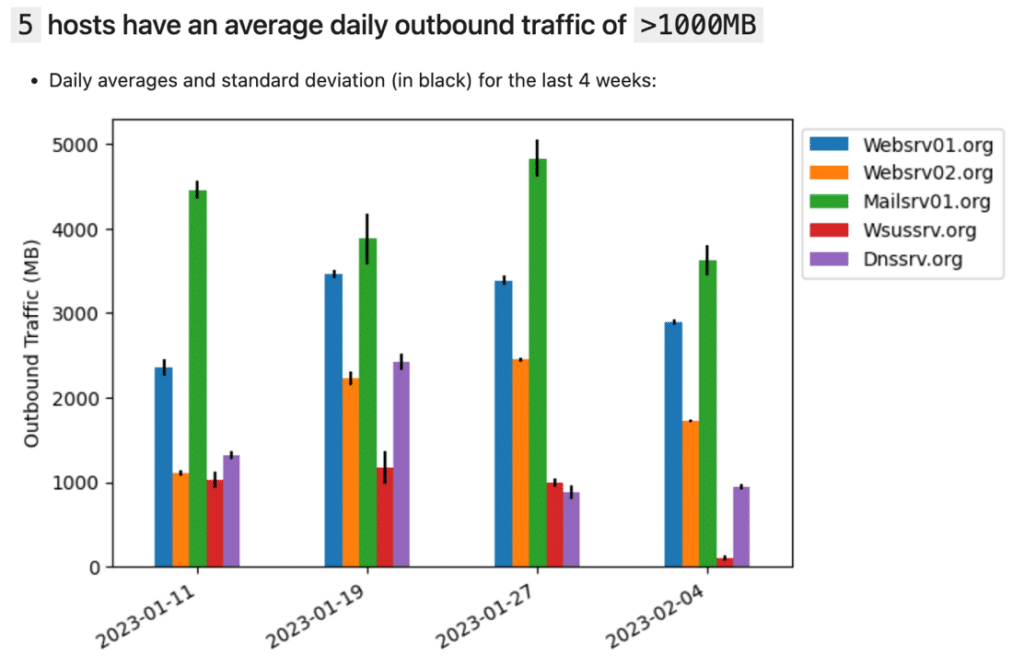
3. Which hosts regularly transmit more than one gigabyte a day of outbound traffic?
3. Anomalous activity layer
It might come as a surprise, but in modern IT environments, statistical anomalies happen very frequently: users often log in from new devices, hosts are occasionally accessed from uncommon IP addresses, and so on. Although such individual anomalies are usually not interesting enough to trigger an alert, in many cases they can provide important insights, if queried as a data source. For this reason, in Velocity XDR, all anomalies are streamed to a relational table. This table contains informative metadata such as the associated entity, pointers to the raw events, as well as the count and identifiers of additional entities – if any – in which the anomalous behavior is considered normal. For example, if a process such as ‘PsExec’ is executed on a certain host for the first time, Velocity XDR specifies the number of additional machines in which ‘PsExec’ has been executed in the past and retrieves their names.
Examples of investigative queries:
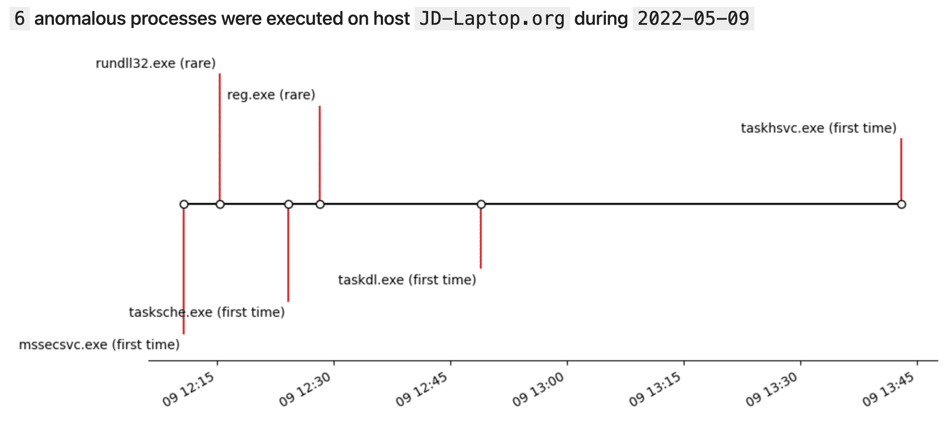
- What irregular, anomalous processes were executed on JD-Laptop on May 9, 2022?
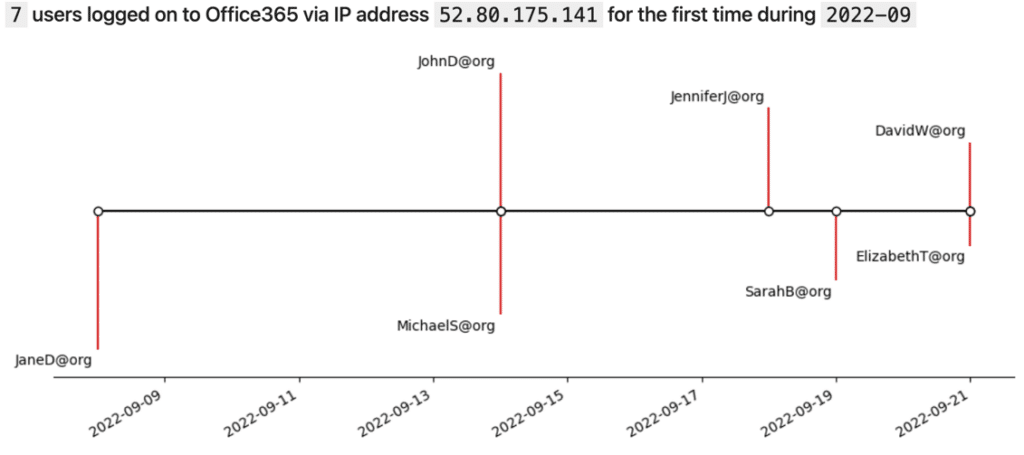
2. How many users logged on from the IP address 52.80.175.141 for the first time in September 2022?
Conclusion and future directions
In this article, we described and demonstrated how valuable analysis insights can be derived from data generated by internal UEBA components.
As AI technology continues to advance, the AI capabilities of Velocity XDR will continue to be enhanced. As this is being done, we will continue to take into consideration not only the end-product user interface, but also how to extract new data layers that can dramatically improve analytical processes.
Ready to amplify your security operations? Book a Demo to see Sygnia’s Velocity MXDR in action.

By clicking Subscribe, I agree to the use of my personal data in accordance with Sygnia Privacy Policy. Sygnia will not sell, trade, lease, or rent your personal data to third parties.